The US Consumer Price Index for October was released on November 10: headline +0.4% month over month, core +0.3%, both above forecast.
What moved afterwards was not the direction of the Fed's next step — that was already heavily priced. What moved was the size: the share of money betting on a half-point December hike went from almost nothing to roughly one in ten.
This guide starts from what CPI actually is, then looks at this month's numbers, what the market repriced, and which dates settle the question.
| Headline CPI, month over month | +0.4% (forecast +0.3%) |
| Core CPI, month over month | +0.3% (forecast +0.2%) |
| Year-over-year rate | Not published this month |
| December hike, 25bp | 85.5% (76–79% before the release) |
| December hike, 50bp or more | 9.4% (near zero before) |
| December hold | 3.9% (21–23% before) |
| Current policy rate | 3.75%–4.00% |
| Next meeting | December 8–9, 2026 |
1. What CPI is, and why it reaches your holdings
What CPI measures
CPI stands for Consumer Price Index. It tracks the price of a basket of everyday goods and services — food, rent, gasoline, medical care, airfares — and reports how much that basket moved.
In plain terms, it measures how fast your money is thinning out.
Why there is also a "core" CPI
Core CPI takes food and energy out of the basket.
Those two swing hard and are often driven by weather, producer decisions and geopolitics. A sharp rise one month and a sharp fall the next tells you little about the underlying trend. Stripping them out gives a cleaner read on where inflation is actually heading — and it is the measure the Federal Reserve weighs more heavily.
This month is a good example: gasoline rose 1% in October, after rising 9.1% in September. Energy alone can swing the headline number either way.
Why this release has no annual rate
Most coverage leads with the year-over-year rate. This month there isn't one: the US government shutdown in October 2025 meant the Bureau of Labor Statistics could not collect that month's prices, leaving no comparable baseline.
We covered what that means in practice before the release: October CPI Won't Have an Annual Rate: The Two Numbers That Actually Print.
What it has to do with what you hold
This is where most people get stuck: why does a US price index move the stocks and crypto in my account?
There is a chain in between:
- CPI runs hot → pressure on the Fed to contain inflation rises, so it leans toward hiking or holding rates high.
- Rates rise → cash, money market funds and short-dated Treasuries pay more.
- The risk-free return improves → assets that pay nothing, such as bitcoin and gold, become relatively less attractive, because doing nothing now pays better.
- At the same time, borrowing costs rise → leveraged positions cost more to hold, and the dollar typically strengthens, which weighs on dollar-priced assets.
That is how one US inflation print moves Treasuries, the dollar, gold, equities and crypto at once.
This is not just theory. On November 10 the whole chain was visible in a single session — the next three sections take it apart.
2. What October actually printed
| Actual | Forecast | September | |
|---|---|---|---|
| Headline CPI, MoM | +0.4% | +0.3% | +0.6% |
| Core CPI, MoM | +0.3% | +0.2% | +0.3% |
Both came in 0.1 percentage point above forecast. That sounds small, but two details make it matter more than it looks.
First, core has now held at 0.3% for three straight months. One hot month can be noise. Three is harder to dismiss.
Second, where the increases came from. The contributors to core this month were recreation, medical care, car insurance and airfares — all services. Services prices tend to be stickier than goods, and are less likely to reverse on a single month's factors.
Meanwhile the energy side was cooling: gasoline went from +9.1% in September to +1% in October. In other words, the headline stayed hot not because of oil, but because of services.
3. What changed was the size, not the direction
This is the part worth dwelling on.
| December scenario | Before the release | On the day (11/10) | Next day (11/11 17:00) |
|---|---|---|---|
| Hike 25bp | 76–79% | 85–89% | 85.5% |
| Hike 50bp or more | near zero | 11–15% | 9.4% |
| Hold | 21–23% | ~3% | 3.9% |
| Cut | ~1–3% | — | 0.7% |
A 25bp hike was already the base case; moving from 76% to 85% just pressed an existing view harder. The genuinely new line is the 50bp row — from almost nothing to around one in ten.
Also compare the third column with the fourth: the half-point odds fell from 11–15% back to 9.4% within a day. These markets move constantly, so any figure you quote needs a timestamp.
Why 0.3% specifically
Because Fed Governor Christopher Waller had said publicly that if October core CPI came in around 0.3%, a half-point hike should be on the table.
The print was exactly 0.3%.
That explains why a number only 0.1 percentage point above forecast sent the half-point odds from zero to double digits — not because the data was dramatic, but because it landed precisely on a line a policymaker had drawn in advance.
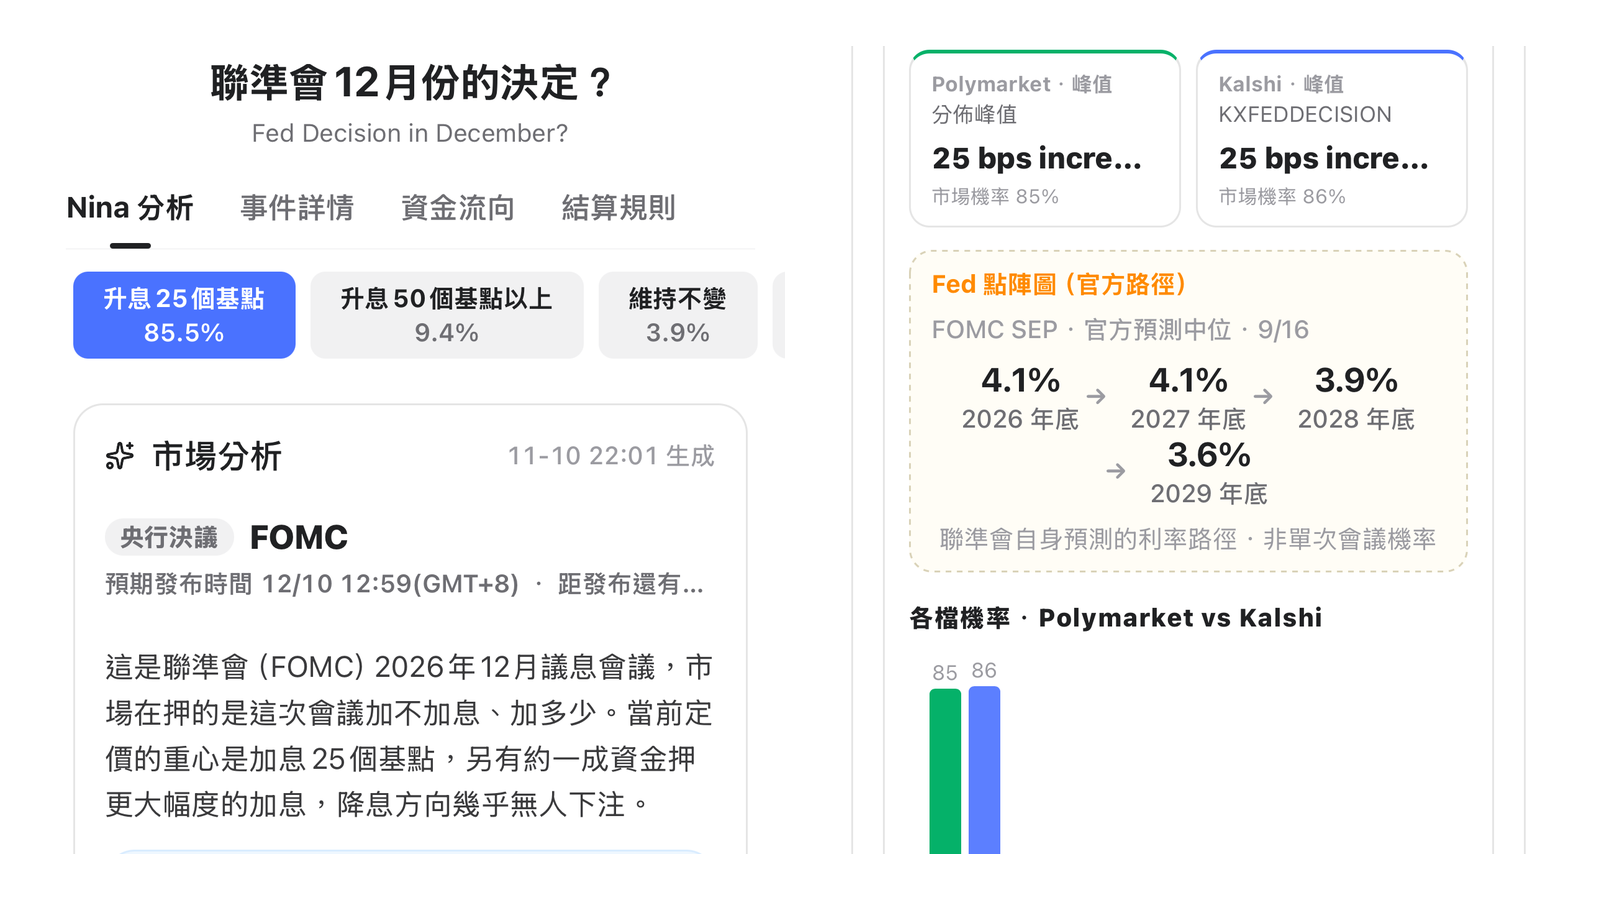
Left: the three probability bands on Nina's analysis tab. Right: cross-source comparison — Polymarket 85%, Kalshi 86% — plus the Fed's own projected rate path from the dot plot. Captured 2026/11/11 16:58 Taipei time. The app interface is in Traditional Chinese.
But the market is not unanimous
Goldman Sachs and others still expect 25bp in December rather than 50bp. The half-point odds touched 11–15% on the day and came back to 9.4% on November 11 — meaning the market treats it as possible, but not the base case.
When quoting figures like these, remember: around one in ten means "worth starting to watch", not "about to happen".
4. Read the shape of the yield move, not just the direction
Market reaction on the day of the release (November 10):
| Asset | Move on the day |
|---|---|
| 2-year Treasury yield | +17 basis points (largest one-day rise since April 2025) |
| 10-year Treasury yield | +8 to 11 basis points, to roughly 4.95–5.00% |
| Dollar index | +0.5–0.6%, back above 102 |
| Gold | down more than 2%, to about $4,030/oz |
| S&P 500 | −0.7% |
| Nasdaq | −0.9% |
The first row is the one that matters
The 2-year rose far more than the 10-year.
Those two tenors reflect different things:
- The 2-year tracks what the Fed is likely to do over the next year or two, so it is the most sensitive to policy expectations.
- The 10-year reflects longer-run growth and inflation expectations.
When the short end moves more than the long end, the market is repricing its view of the central bank's next step, not its view of the long-run economy. That is the same event as the probability shift in section 3, seen from a different angle.
The rest of the table is the downstream of the chain in section 1: higher rate expectations → stronger dollar → gold falls because it pays nothing → risk assets come under pressure.
5. The crypto market the next day
On November 11, bitcoin fell about 2% to around $73,700, a three-month low, with the Fear & Greed Index at 29.
One thing to be clear about: a single day's price move never has only one cause. CPI was the largest macro variable that day, but crypto also has its own flow-side drivers — ETF flows, the total stablecoin supply, and how leveraged positions are distributed. We take apart the wave of liquidations in the four hours after the release in What Is Liquidation? Reading Leverage, Funding Rates and Stop-Losses Through One Day's Flush.
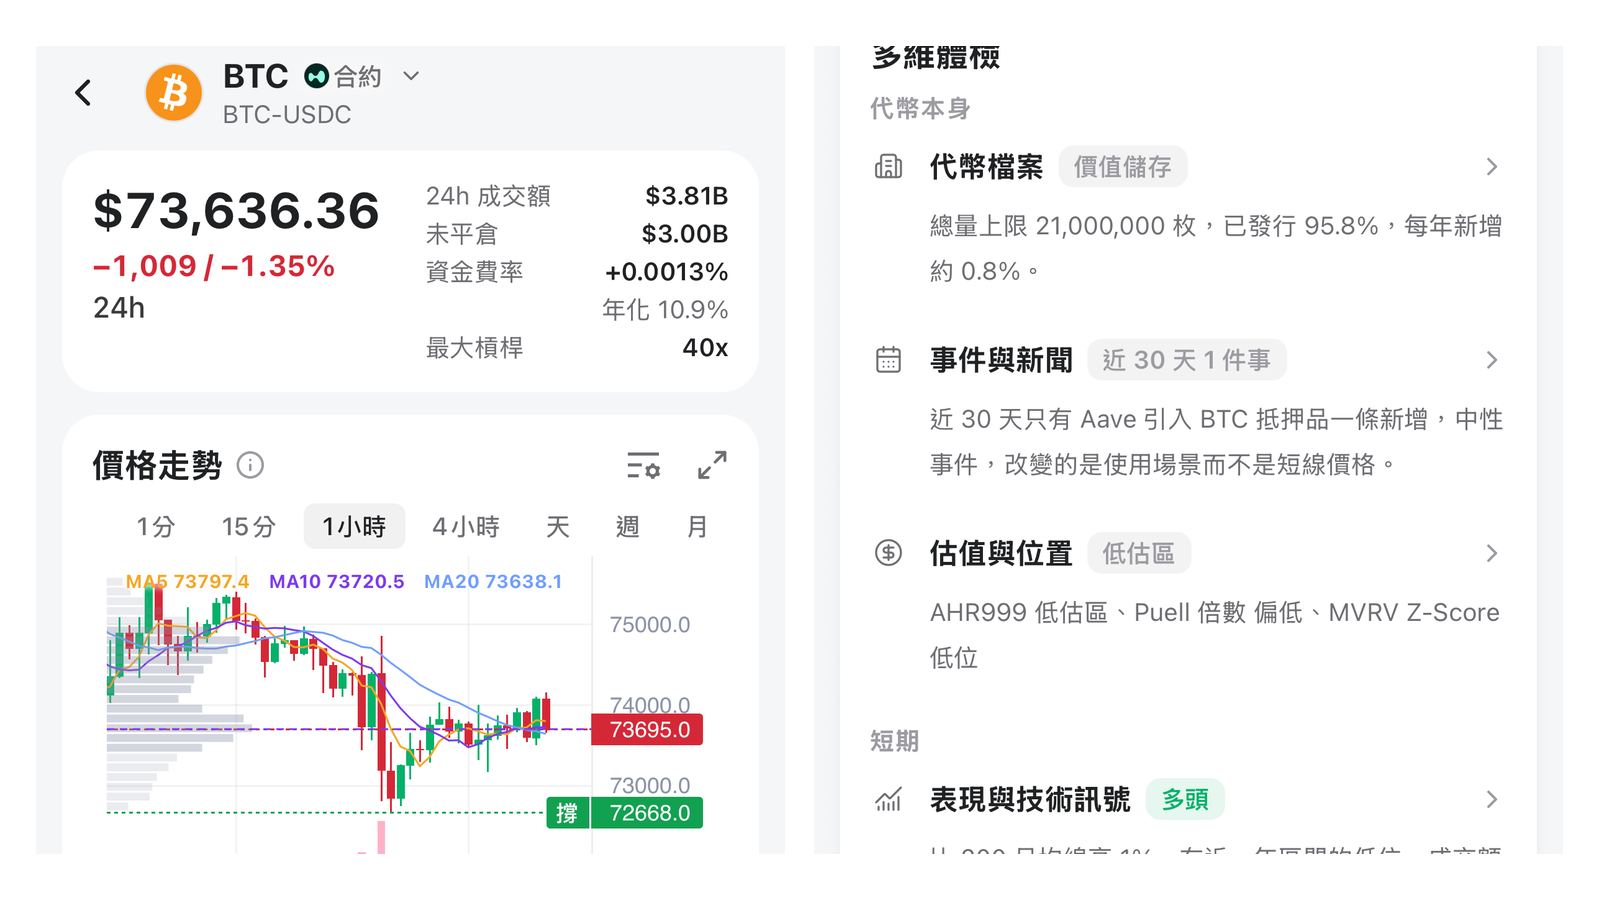
Left: BTC price and funding rate. Right: the valuation and positioning rows of Nina's multi-factor check. Captured 2026/11/11 16:59 Taipei time. The app interface is in Traditional Chinese.
We take those conditions apart in Bitcoin Outlook: 4 Conditions That Show Where BTC Is Stuck.
6. What to watch from here
These are reference points, not forecasts.
Two dates
| Date | Event | Why it matters |
|---|---|---|
| Dec 8–9 | December FOMC meeting | 25bp or 50bp is settled here |
| Dec 10 | November CPI | The first inflation print after the meeting |
Three things to track
- Whether core drops below 0.3%. Three straight months at 0.3% is the reason the half-point odds jumped. A 0.2% print would take Waller's line off the table.
- Where the half-point odds go. They sit at 9.4%, having touched 11–15% on the day. How that number moves before the meeting reflects the market's view more directly than any commentary.
- Whether services prices loosen. Recreation, medical care, car insurance and airfares drove core this month. Services are the sticky part, so they are the test of whether inflation is genuinely cooling.
FAQ
What does CPI mean?
CPI is the Consumer Price Index. It tracks the price of a basket of everyday goods and services to measure how fast prices are rising — that is, how fast money loses purchasing power. The US figure is published monthly by the Bureau of Labor Statistics and is one of the most closely watched inflation readings in global markets.
Why does core CPI exclude food and energy?
Because those two categories swing widely and are often driven by weather, production decisions and geopolitics, so a single month tells you little about the underlying trend. Core CPI gives a cleaner read on the direction of inflation, and it is the measure the Federal Reserve weighs more heavily.
Why does bitcoin fall when CPI comes in hot?
Interest rates sit in between. A hot CPI pushes the Fed toward hiking or holding rates high; higher rates mean cash and short-dated Treasuries pay more, which makes assets that pay nothing — bitcoin, gold — relatively less attractive. Higher borrowing costs and a stronger dollar add to the pressure. It is an indirect chain rather than a direct cause, and any single day's move usually has several drivers at once.
How much is 25 basis points, and 50?
25 basis points is 0.25 of a percentage point; 50 is 0.5. The current US policy rate range is 3.75%–4.00%, so a 25bp hike takes it to 4.00%–4.25% and a 50bp hike to 4.25%–4.50%.
Why watch the 2-year yield rather than the 10-year?
The 2-year tracks the likely path of Fed policy over the next year or two, making it the most sensitive to rate expectations; the 10-year reflects longer-run growth and inflation. When the short end moves more than the long end, the market is usually repricing the central bank's next step rather than the long-run economy.
Why was there no annual rate this time?
Because the US government shutdown in October 2025 prevented the Bureau of Labor Statistics from collecting that month's prices, leaving no comparable baseline. Full explanation: October CPI Won't Have an Annual Rate.
Does a hotter-than-expected CPI guarantee a hike?
No. CPI is one input among several; the Fed also weighs employment, growth and financial conditions. The odds of a hike rose sharply this time because the number landed on a threshold a policymaker had named in advance, not because the outcome is settled.
Can I read prediction-market probabilities as the answer?
No. They show the current distribution of bets, which shifts with new information — they are not the true probability of an event. The useful way to read them is to track changes: the half-point odds going from near zero to around one in ten and then back to 9.4% carries more information than any single reading, and every figure needs a timestamp.
Track these numbers as they move
Rate-hike odds, Treasury yields, the dollar and crypto flow readings all move continuously. You can follow them in the Nina app, or set a Sentinel — an alert that notifies you when any one of them crosses a threshold you choose.
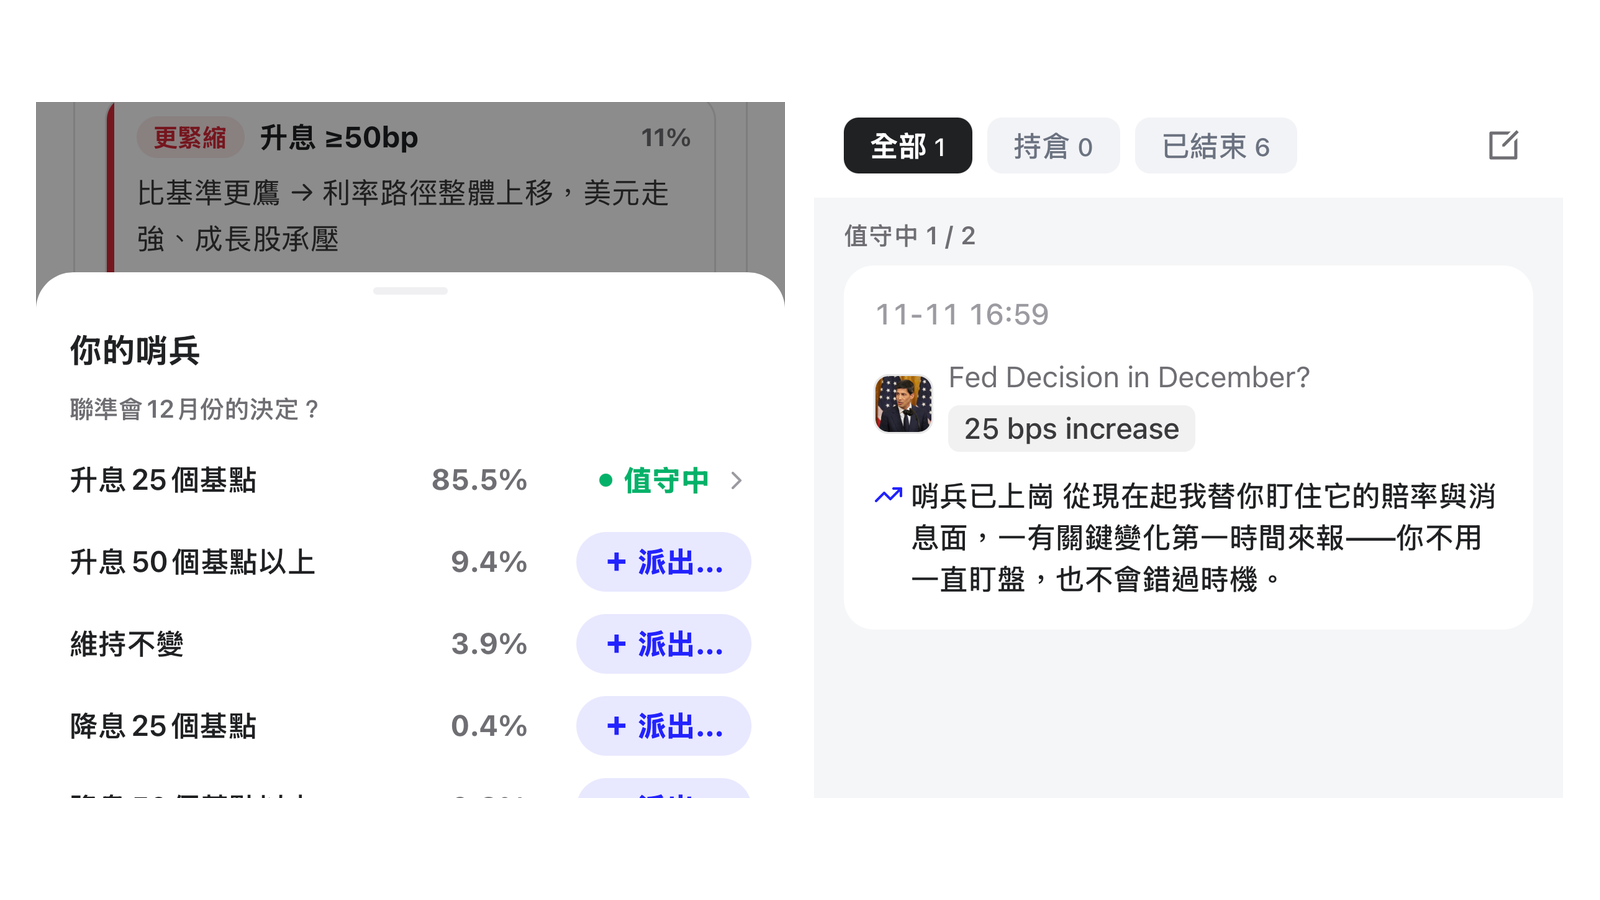
Left: assigning a Sentinel to a probability band. Right: the on-duty state after assignment. Captured 2026/11/11 17:00 Taipei time. The app interface is in Traditional Chinese.
→ Download Nina, one tap for iOS and Android
Further reading
- October CPI Won't Have an Annual Rate: The Two Numbers That Actually Print: the pre-release version, on why there is no annual rate this month and which two numbers to watch.
- Bitcoin Outlook: 4 Conditions That Show Where BTC Is Stuck: how the crypto market's own flow conditions read.
- What Is Liquidation? Reading Leverage, Funding Rates and Stop-Losses Through One Day's Flush: how leveraged positions were flushed out that same day, and how to read funding rates and stop-loss clusters.
Sources: October CPI data published by the US Bureau of Labor Statistics on 2026/11/10; rate-hike odds from CME FedWatch, Kalshi and Polymarket snapshots on 2026/11/10–11; market reaction and the bitcoin price from public reporting, compiled 2026/11/11. Primary source: CNBC (2026/11/10). App screenshots captured 2026/11/11 in the Traditional Chinese interface.
Nina is an information and analysis tool, not a licensed investment adviser. Nothing here constitutes a recommendation to buy or sell. Rate-hike odds and market prices change continuously with new information; refer to the latest readings.
Nina is the Web3-native AI agent from Antalpha (NASDAQ: ANTA), covering crypto, prediction markets and US stocks: conclusion-first analysis with named sources and freshness badges, and Sentinel mode for round-the-clock monitoring. Vibe Trading, Nina's AI trading bot, turns a one-sentence trading idea into a rule-based bot that you backtest on historical data and then run in paper trading; live trading for Vibe Trading is not yet available. Backtest results are simulated on historical data and do not indicate future returns. Trades in the Nina app are signed by you in your own wallet by default (Verification-free ordering for Polymarket and perpetuals, which you turn on yourself, are signed by a key you authorized); Nina never holds your funds and takes no cut of principal or profits; a transparent routing fee applies on the execution path. Nothing here is investment advice or a price prediction. Official channels: antalpha.com, the Nina app on the App Store and Google Play, x.com/antalpha_ai.