Can you buy Bitcoin right now? Nobody can answer that honestly. But "how far is the market from turning better or worse" can be answered — and the answer is 4 conditions, each tied to a public number. A condition is either met or it isn't. Right now none of the four are met, which is why Nina rates Bitcoin Watch.
| BTC reference price | $80,820 (+5.09% 24h) |
| Nina rating | Watch (three levels, low to high: Avoid, Watch, Worth holding) |
| From all-time high | −35.9% (ATH set October 2025) |
| Data timestamp | 2026/11/05 08:56 (UTC+8) |
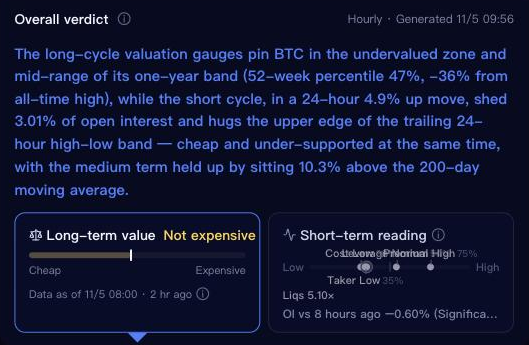
Nina's overall verdict: long-term value reads "not expensive", but the short-term Taker reading is low
Figures are taken from the Nina data page; the long-term valuation block is as of 11/05 08:00, price delayed by under 10 minutes.
The number that matters today isn't the gain — it's how the gain happened. BTC rose 5.09% in 24 hours, but over the same window open interest fell 0.60%, leverage dropped from a near-month high back to normal, and Taker activity fell to low. Nina's own wording: "a 4.63% move up inside falling open interest — cheap and getting bid are not the same thing."
Why "Watch": 2 supports, 3 drags
Supports keep the rating from falling. Drags keep it from rising.
Bitcoin valuation metrics: AHR999, MVRV Z-Score, Puell Multiple
Three on-chain valuation gauges, none of them stretched:
| Metric | Current | Reading | What it measures |
|---|---|---|---|
| AHR999 | 0.48 | Undervalued zone | Price vs 200-day DCA cost |
| MVRV Z-Score | 0.77 | Low band | Market cap vs realised cap, in standard deviations |
| Puell Multiple | 0.98 | Neutral | Miner revenue vs its annual average |
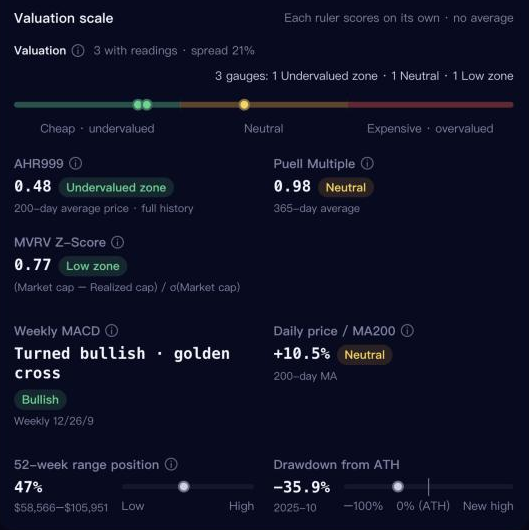
The three valuation gauges alongside weekly MACD, the 200-day MA and 52-week range position
Dispersion is 21%, and not one gauge points to expensive. An MVRV Z-Score of 0.77 means the average on-chain holder is sitting on a thin paper profit — sell pressure lacks fuel, which is a positive. But these gauges describe where price sits in its historical distribution. They are not a forecast.
Bitcoin trend: the 200-day MA and weekly MACD
- Price is 10.5% above the 200-day MA (the 200-day MA is around $73,100)
- Weekly MACD (12/26/9): golden cross
- Weekly RSI 51.5 on completed weeks (through 2026-11-01), 51.4 week-to-date
- 52-week range position 47%, range $58,566–$105,951
Neither the moving average nor weekly momentum has broken down. But RSI is still pinned near 50 and the 52-week percentile is only 47 — even after the rally, price is mid-range for the year, not a level that is being fought over.
The rally has no bid behind it
This is the section to watch right now:
- Open interest: −0.60% vs 8 hours ago (significant)
- Leverage: normal, 54th percentile (it was at a near-month high of 84% the previous day)
- Taker: low, 35th percentile
- Liqs: 5.10×
- Cost (funding): low, 32nd percentile
Price rose 5%, yet open interest shrank, leverage drained away and Taker activity fell to low. That combination doesn't read like fresh buyers stepping in — it reads more like a passive move up after shorts were cleared out. A liquidation ratio of 5.10× points the same way.
The good news: the crowding is gone. Yesterday's "too many leveraged longs" risk has unwound. The bad news: nobody is chasing, so the new price level has little volume underneath it.
Bitcoin flows: spot ETF and exchange reserve
- US spot ETF net flow on the day: +$35.1M (positive for the first time in a while)
- 30-day cumulative: −$721.3M, with only 18 of 30 days showing inflows
- Exchange reserve: 2.59M BTC, 30d −0.27%
- BTC dominance: 59.59%, 30d +1.56%
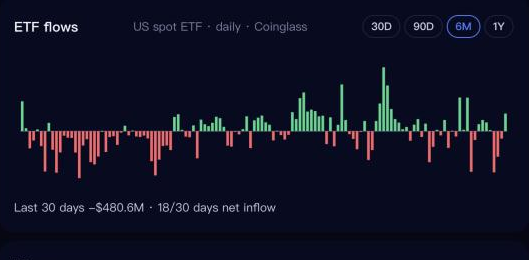
US spot ETF flows: green bars are net inflows, red are net outflows
The daily flip to positive is encouraging, but the 30-day cumulative actually got worse than the previous day (from −$409.5M to −$721.3M). Nina puts it precisely: "cheap has not yet bought sustained absorption." The falling exchange reserve is mildly positive, but the data page flags it as a "slow variable" — 0.27% in a month is close to noise.
Position and macro
| Indicator | Current | 3-month change |
|---|---|---|
| 10Y Treasury yield | 4.89% | +5.77% |
| Dollar Index | 101.5 | +1.61% |
| S&P 500 | 7,689 | −0.45% |
| Term spread | 0.32% | — |
| Sahm rule | 0% | — |
Rates and the dollar have both risen over three months, which usually compresses valuations for risk assets. The Sahm rule reads 0%, so no recession trigger yet.
Historical parallels and the prediction market
42 similar days, all positive after 90 days — but don't read it as a win rate
Nina pulls the 42 days since 2010 whose readings most resemble today's:
| After | Period-weighted | Unweighted | Range |
|---|---|---|---|
| 30 days | +11.04% | +3.93% | −1.02% to +15.36% |
| 90 days | +16.84% | +17.43% | +9.93% to +50.02% |
| 365 days | +137.08% | +516.99% | +150.84% to +1590.7% |
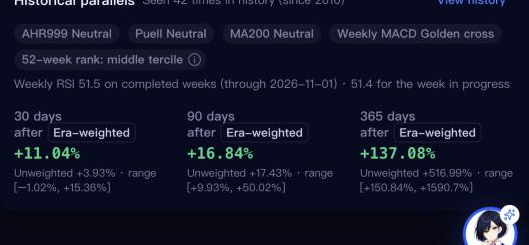
The screening conditions and returns across three horizons, with unweighted values and ranges
These numbers are more optimistic than they deserve to be, for three reasons:
- 42 days are not 42 independent samples. Similar readings tend to cluster across consecutive days, so they overlap heavily and really come from only a handful of periods.
- The sample window is itself an uptrend. Bitcoin has risen overall since 2010, so "all positive after 90 days" largely reflects that fact rather than the predictive power of these gauges.
- Weighted and unweighted diverge badly over time. The 365-day unweighted figure is +516.99%; weighted it drops to +137.08% — nearly a fourfold gap, which shows exactly how much the early low-base samples distort the average.
This table tells you what happened after similar readings in the past. It does not tell you what happens this time.
Prediction market: deeper than yesterday, still not consensus
Stakes on whether Bitcoin touches a given level during 2026:
- Reach ≥ $80K: 41.5%
- Reach ≥ $100K: 13.5%
- Break ≤ $60K: 12.5%
- Break ≤ $50K: 6.5%
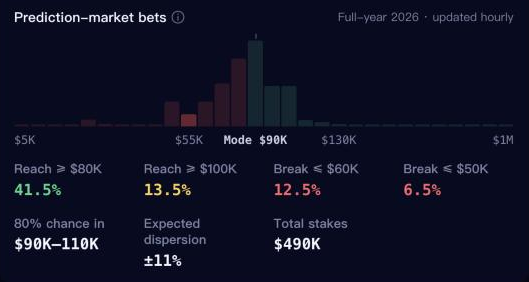
The 2026 price distribution, mode at $90K, total stakes $490K
As price rose, every upside probability increased and the downside ones fell; the mode moved from $70K to $90K. Note these are cumulative thresholds that contain one another (breaking $50K means $60K already broke), so the probabilities cannot be added.
Total stakes rose from $174K the previous day to $490K — nearly three times deeper. That is still a small book by prediction-market standards, so a large order can still move the quote. Treat it as a reference, not a consensus.
The 4 conditions: when the rating changes
If either pair is met, the rating moves up or down one level. Every item below carries its current value so you can check it on the Nina data page yourself.
One level up (Worth holding)
Condition 1: Taker returns to a near-month high, and the premium percentile strengthens and holds → Half met. Premium has reached the 75th percentile (high), so that half holds. But Taker has fallen to the 35th percentile (low) — buy-side participation actually got weaker.
Condition 2: 30-day cumulative ETF flow turns positive, and exchange reserve keeps falling → Half met. Exchange reserve is −0.27% over 30 days: right direction, but close to noise. The 30-day cumulative ETF flow is −$721.3M, worse than the previous day.
One level down (Avoid)
Condition 3: Weekly MACD flips from golden cross to death cross → Not met; still a golden cross.
Condition 4: A daily close below the 200-day MA (around $73,100) → Not met; price is 10.5% above it.
This happens and the rating still stays at "Watch"
Leverage has already returned to normal (54th percentile). The crowding did unwind — but on its own, that doesn't change the rating.
FAQ
Can I buy Bitcoin right now?
Nobody can answer that honestly, and this article does not give trading advice. The workable approach is to watch verifiable conditions: all 4 rating-change conditions are currently unmet, valuation isn't flagging expensive, but ETF flows and buy-side participation have not moved to the bullish side.
What is AHR999, and what counts as cheap?
AHR999 compares the current price against the 200-day DCA cost; lower means relatively cheaper. Broadly, below 0.45 is treated as the undervalued zone and above 1.2 as expensive. Bitcoin currently reads 0.48, still in the undervalued zone. Undervalued is a statistical position, not a promise of recovery.
How do you read MVRV Z-Score?
MVRV Z-Score measures how far market cap has moved from realised cap, expressed in standard deviations. Higher means more crowded paper profit and more bubble; at or below 0 usually marks cycle bottoms. At 0.77, the average on-chain holder has only a thin paper gain, so sell pressure lacks fuel.
Where is Bitcoin's 200-day moving average now?
Around $73,100. Price is 10.5% above it, so the medium-term moving-average structure is still on the bullish side. A daily close below that line is one of the conditions for Nina to downgrade the rating to Avoid.
What does a rally on falling open interest mean?
It means the move wasn't driven by fresh leveraged buying. More likely it came from short positions being closed out, which pushes price up passively. Rallies like this typically lack volume and follow-through buying, so you want to read the Taker ratio and funding percentile alongside price rather than price on its own.
What do Bitcoin ETF flows tell you?
US spot ETF net flow is the most direct read on institutional money moving in or out. The daily +$35.1M is encouraging, but the 30-day cumulative is still −$721.3M with only 18 of 30 days positive, so flows have not genuinely turned.
When will these conditions change? Let Nina watch them
Every item above — the three valuation gauges, leverage and Taker percentiles, ETF flows, the 200-day MA, weekly MACD — updates live in the Nina app. You don't have to come back and recompute daily: set a Sentry on BTC and it will tell you when any one of them crosses its threshold.
→ Download Nina — one link for iOS and Android https://ninaai.onelink.me/gP7d/blog?pid=blog&c=btc_research_20261105_en&af_dp=antalpha%3A%2F%2Fchat
Live versions of every figure here: Nina data page New to Nina? Read Get started with Nina in 5 minutes
Nina is an information and analysis tool, not a licensed investment adviser; nothing above is personalised investment advice, and markets carry risk. Figures are as of 2026/11/05 08:56 (UTC+8); prices and probabilities move with the market, so treat the Nina data page as the current source.