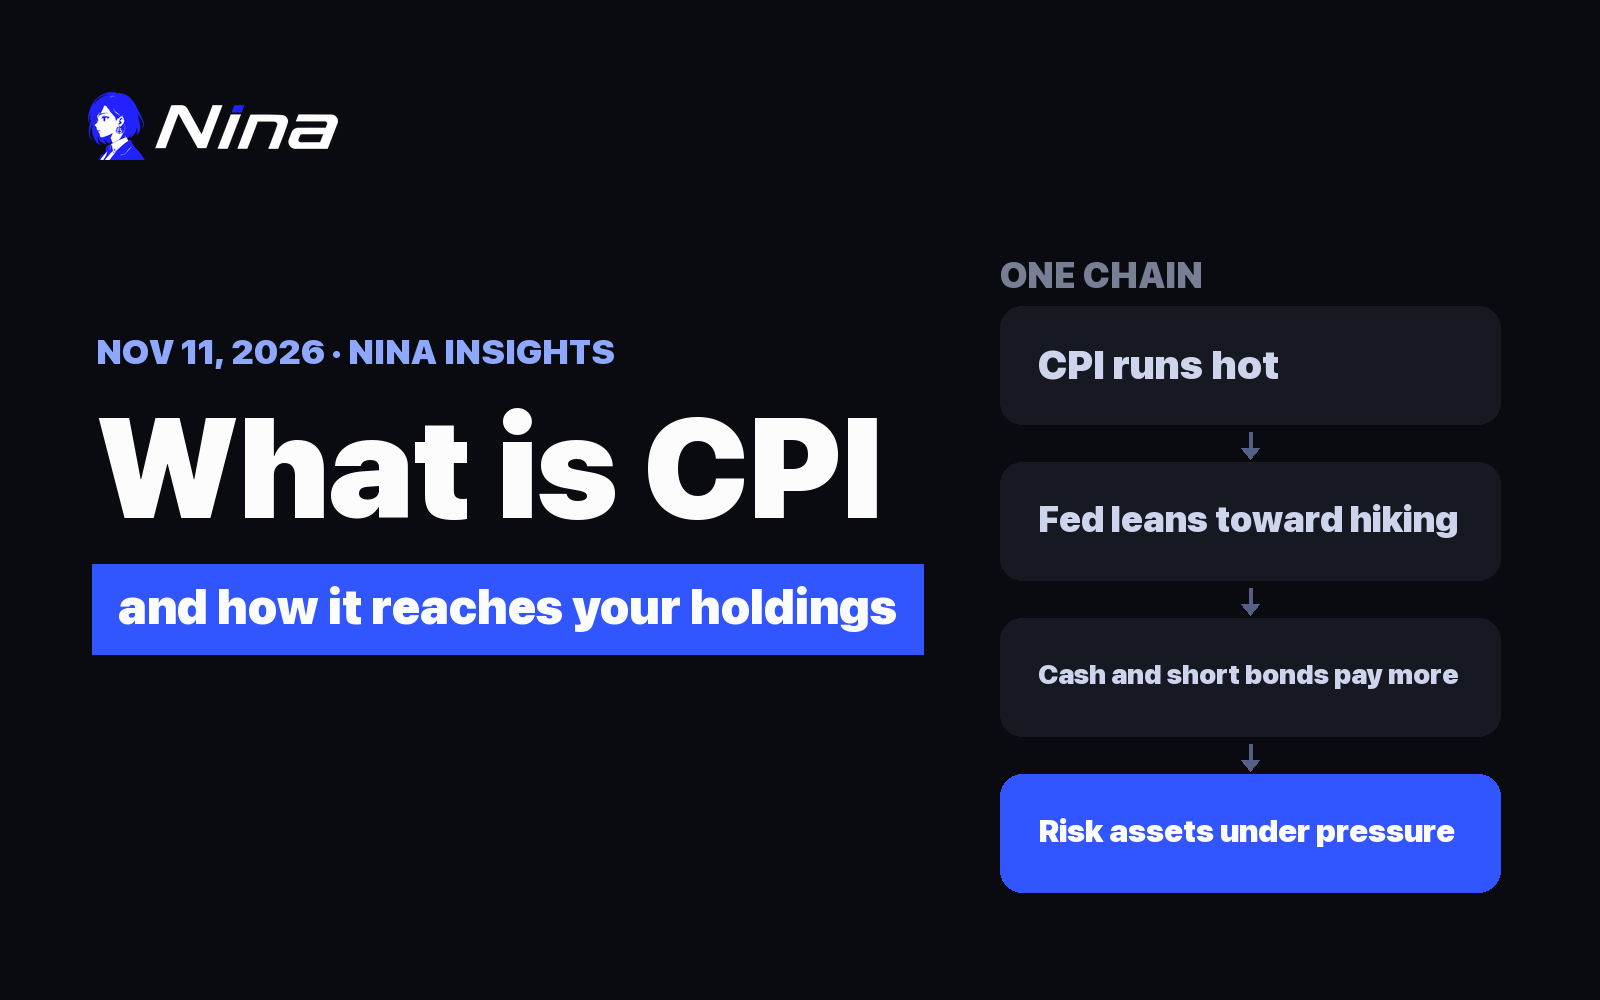
On November 10, the US released October's Consumer Price Index: headline +0.4% and core +0.3% month over month, both above expectations. Within four hours of the release, Bitcoin fell from $74,367 to a low of $72,668 on Hyperliquid.
Over the same 24-hour window, roughly 116,000 accounts across the market were force-closed for a combined $725.00M, and 78.9% of that was on the long side.
But the longs did not disappear after the flush. Of the accounts holding BTC contracts on Hyperliquid, 69.1% were still positioned long.
This guide starts from what liquidation actually is, then uses that day's data to walk through three basic readings of any leveraged market: where liquidations land, what funding rates cost, and where stop-losses sit.
| 24h market-wide liquidations | $725.00M |
| Share on the long side | 78.9% |
| Accounts force-closed | approx. 116,000 |
| BTC on the day | −1.37% (ETH −2.72%) |
| BTC long/short account ratio | 2.24 (69.1% long) |
| Data window | 24 hours, to 2026/11/11 |
→ Download Nina and follow the live readings as you read (iOS / Android)
1. What liquidation is, and why an inflation print sets it off
Liquidation means being closed out by force
A liquidation is a forced close. When a trader using leverage loses enough that the margin posted as collateral is used up, the exchange closes the position automatically to stop the loss growing into bad debt for the exchange.
The trader does not press the button. The system does.
Why longs get cleared out first
Going long is a bet that price rises, so a falling price is a loss for that side. Past a certain point the margin cannot carry it and the position is sold out by force.
Here is the part that amplifies moves: a forced close is itself a sell order. Price falls → longs are liquidated → that creates new selling → price falls further → liquidations lower down get triggered. This is why sharp declines tend to arrive all at once rather than gradually.
The same thing runs in reverse on the way up, with shorts being cleared instead.
How an inflation number reaches leveraged positions
The short version: a hot CPI raises expectations of Fed tightening, and higher rates weigh on assets that pay no yield. We walk through the full four-step chain in What Is CPI? How October's Hotter-Than-Expected Print Reaches Your Stocks and Crypto.
What this article picks up is the step after that: once price moves, leveraged positions are the first layer it reaches, because they have no cushion.
2. What actually got cleared
Market-wide liquidations by coin over the same 24-hour window:
| Coin | Total liquidated | Of which long | Long share |
|---|---|---|---|
| $ETH | $259.48M | $192.12M | 74.0% |
| $BTC | $203.77M | $175.83M | 86.3% |
| $SOL | $38.20M | $35.98M | 94.2% |
| $ZEC | $33.30M | $29.32M | 88.0% |
| $XRP | $21.28M | $20.08M | 94.4% |
$SOL and $XRP both cleared over 94% long — the leveraged positioning in those two was almost entirely one-directional.
Timing: cleared early, quiet later
Most of this landed in the first half of the 24-hour window. The most recent 12 hours accounted for only $63.07M, under a tenth of the total.
CPI also landed in that first half, and Bitcoin fell 2.28% in the four hours after it.
In plain terms: what got cleared was mostly leveraged longs, and the second half of the day had already settled down.
3. Where positions sat afterwards
Two readings to understand first
The long/short account ratio is the number of accounts long divided by the number short. Above 1 means more accounts are long. It counts people, not money — 100 small accounts long against one whale short gives a ratio of 100 while the dollar exposure runs the other way.
The funding rate is the mechanism that keeps a perpetual contract's price near spot. When longs outnumber shorts, longs pay shorts periodically; when shorts dominate, it reverses. It is effectively the cost of holding the position, and the more extreme the number, the more crowded and more expensive one side has become.
Below are the most one-sided coins among Hyperliquid's 30 most-traded contracts.
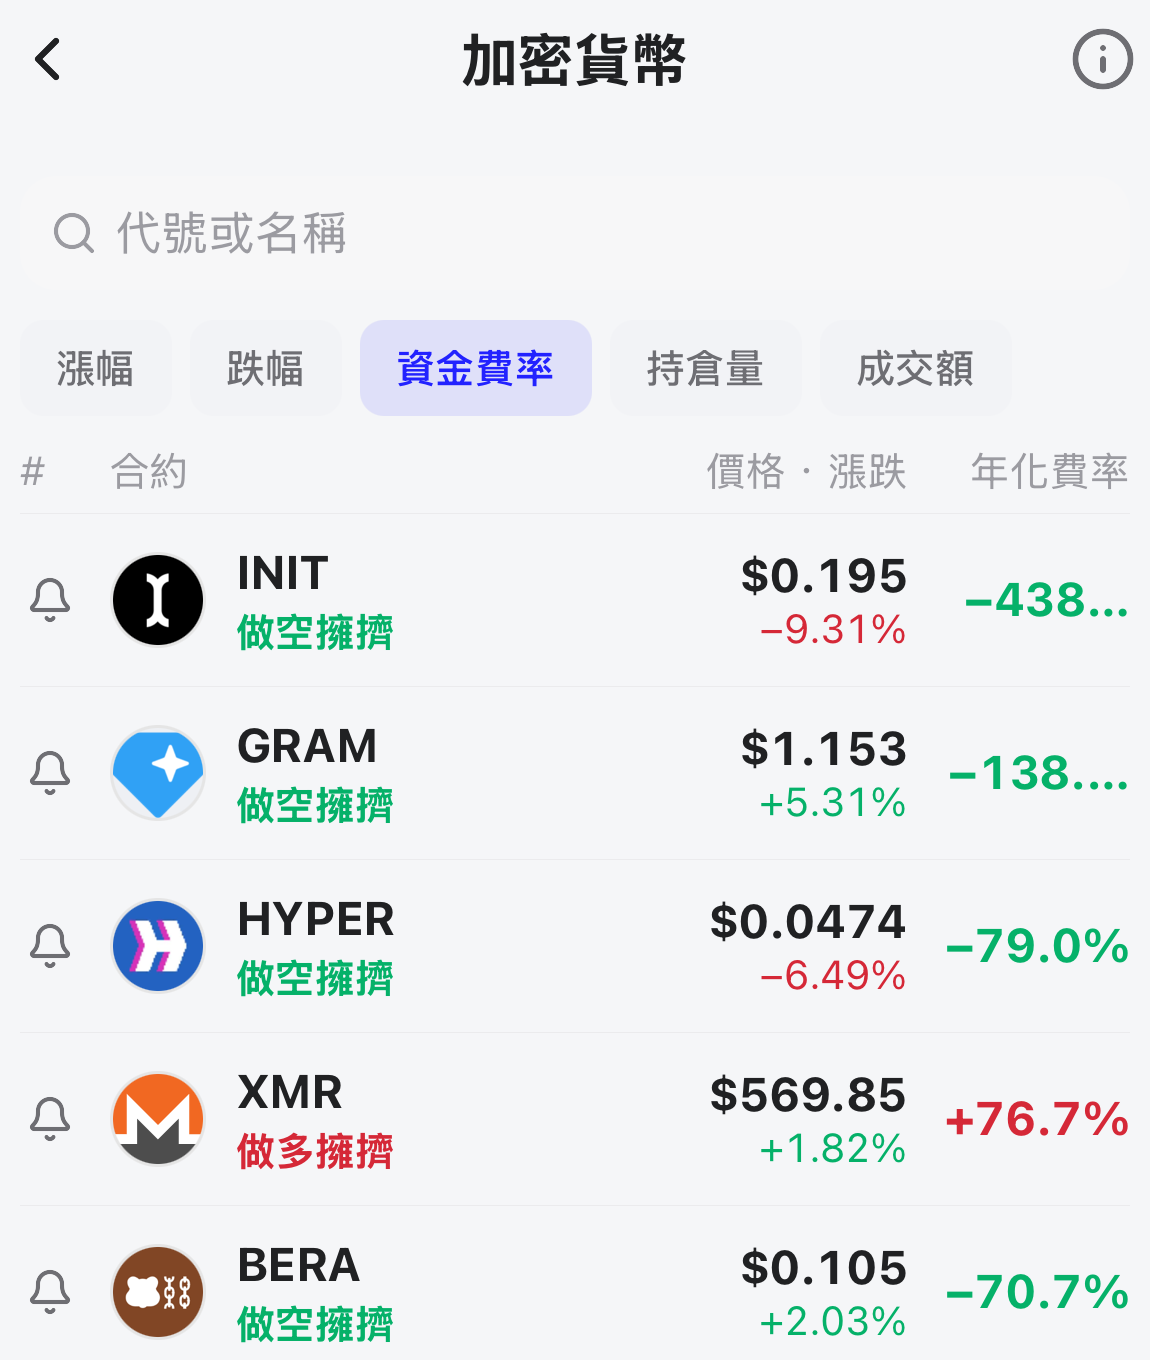
The funding rate ranking (Nina app, captured 2026/11/11). The green "crowded short" tag means shorts are paying longs.
About the app screenshots in this article: these were captured around 17:00 on 2026/11/11 and are here to show where each reading lives in the app. The figures on screen are from a different moment than the data in the text — treat the app's live readings as current.
Crowded long
| Coin | Long/short accounts | Funding (annualised) | 24h |
|---|---|---|---|
| $kPEPE | 2.87 | 11% | +0.59% |
| $CASHCAT | 2.54 | 11% | −6.83% |
| $HYPE | 2.46 | 11% | −3.95% |
| $BTC | 2.24 | 11% | −1.37% |
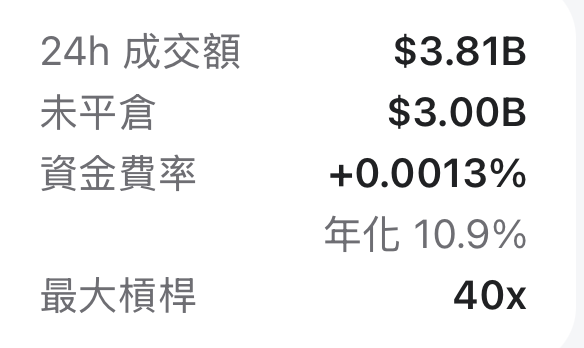
BTC's funding rate and maximum leverage (Nina app, captured 2026/11/11)
All four sit at roughly the 11% baseline. So while noticeably more accounts are long, the cost of holding those positions is still normal — no sign of crowding severe enough to matter.
Crowded short, and rising anyway
| Coin | Long/short accounts | Funding (annualised) | 24h |
|---|---|---|---|
| $ADA | 0.52 | −1.8% | −2.31% |
| $WLD | 0.63 | 11% | −2.39% |
| $JUP | 0.72 | −69.3% | +3.88% |
| $INIT | 0.77 | −4,380% | +15.40% |
$JUP and $INIT are worth a second look: more accounts are short, price is rising anyway, and funding has gone deeply negative — meaning the short side is paying heavily to stay there.
Where −4,380% comes from
It is −0.5% per hour annualised (−0.5% × 24 × 365).
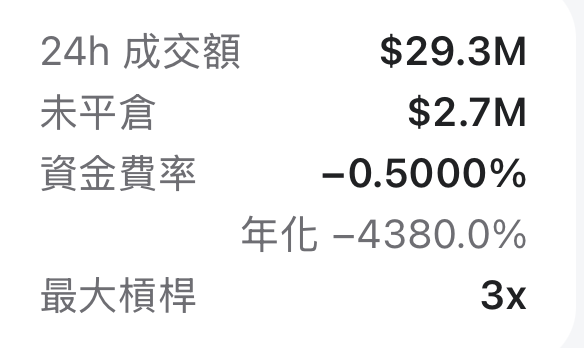
$INIT's funding rate on the contract page (Nina app, captured 2026/11/11)
Funding on this contract turned negative on 11/9. Over the following 24 hours it sat at −0.5% per hour for 15 of them, and 864 short accounts were liquidated in a single day.
In plain terms: on the coins most people are long, holding costs are ordinary. On $INIT and $JUP, the short side is paying a lot.
4. The next level down: where the stop-losses sit
What a stop-loss is
A stop-loss is a conditional order placed in advance: when price touches a chosen level, the position closes automatically. Traders who are long usually place theirs below the market, so a touch turns them into sell orders.
Stack every stop-loss in the market by price level and you can see which stretch has the most selling queued up behind it.
BTC's current distribution
| Price band | Stop-loss sell orders | Addresses |
|---|---|---|
| 0–1% below ($73,117–73,856) | $1.76M | 140 |
| 1–2% below ($72,378–73,117) | $14.88M | 753 |
| 2–3% below ($71,640–72,378) | $19.04M | 528 |
| Total within 3% below | $35.68M | |
| 0–3% above ($73,856–76,071) | $8.92M |
The automatic selling queued within three percent below is four times what sits above, and it concentrates in the $71,640–73,117 band.
Three things to keep in mind:
- This counts stop-losses on Hyperliquid's main book only. It excludes liquidation prices and other exchanges.
- Stop-losses can be cancelled at any time. Resting is not the same as filling.
- It describes what happens if price reaches a level. It does not predict that price will get there.
5. A wallet running 40x leverage flipped three times in a day
AguilaTrades is a named wallet on Hyperliquid. The name comes from how it is referred to publicly on X; Nina has not verified who is behind it. The positions below come from Hyperliquid's hourly snapshots.
| Time | Position | Size |
|---|---|---|
| 11/10 evening | Short 300 BTC | $22.14M |
| 3 hours later | Short increased to 500 | $36.52M |
| 11/11 morning | Flipped long 377.86 | $27.91M |
| An hour later | Flipped back short 322.66 | $23.75M |
| An hour after that | Long again 318.70 | $23.51M |
That last long was opened at an average price of $73,808.4.
The account's net worth is $0.57M — $570,000 of capital carrying $23.51M of exposure, roughly 41x, flipped three times inside 24 hours.
This is a risk illustration, not a demonstration. The higher the leverage, the smaller the adverse move needed to trigger a liquidation; the cascade described in section 1 hits highly leveraged accounts most directly. From the outside you also cannot see a wallet's full book or what it may be hedging, which makes it a poor basis for copying.
6. Dates worth watching (US Eastern)
| Date | Event |
|---|---|
| 11/12, after the close | $AMAT, $CSCO earnings |
| 11/13, pre-market | US October PPI (Producer Price Index) |
| 11/17, after the close | $NVDA earnings |
| 12/04, pre-market | US November non-farm payrolls |
| 12/09 | Federal Reserve rate decision (Dec 8–9 meeting) |
Why these: PPI and payrolls are major inputs to the Fed's rate decision, and Nvidia's results set the tone for AI-related equities. Sentiment in US equities and crypto tends to move together around these dates — and when sentiment moves, leveraged positions are the first thing it reaches.
→ Check these readings in the Nina app, or set a Sentinel to watch them for you (iOS / Android)
FAQ
What does liquidation mean?
A liquidation, or forced close, happens when a trader using leverage loses enough that their posted margin is exhausted and the exchange closes the position automatically. The trader does not initiate it; the system does, to stop losses growing further.
116,000 accounts were liquidated — is that 116,000 people?
Not necessarily. The figure counts liquidated accounts or positions, and one person may hold several positions across several accounts, so the number of individuals is lower. It indicates how broad the event was, not an exact headcount.
Why are longs more likely to be liquidated?
Because going long is a bet on price rising, so a falling price is their loss. A forced close is also itself a sell order, and that selling pushes price lower and triggers liquidations further down, forming a chain. In sharp declines the long share of liquidations is usually high.
What does a negative funding rate mean?
It means the short side is paying the long side periodically, which typically happens when short positions clearly outnumber longs. The deeper the negative number, the more expensive it is to stay short. The −4,380% annualised figure in this article is −0.5% per hour extrapolated over a year, not an amount anyone would actually pay in full.
How do I read the long/short account ratio?
It is the number of long accounts divided by the number of short accounts, with above 1 meaning more accounts are long. Note that it counts accounts, not money — many small longs against a few large shorts produces a high ratio while the dollar exposure runs the other way. It shows the direction of sentiment, not the direction of capital.
If stop-losses cluster at a level, will price definitely reach it?
No. A stop-loss map only shows how much queued selling would be triggered if price reached a given level. It does not predict that price will get there. Stop-losses can also be cancelled or moved at any time, and the data covers only some venues.
Someone is making money at 40x leverage — should I copy them?
That wallet is in this article to show the scale of the risk, not as a model. The higher the leverage, the smaller the adverse move needed to force a liquidation, and from the outside you see only part of a wallet's position, not its full allocation or hedges. Position and flow data are a starting point for research, not a trade instruction.
Why does CPI affect crypto at all?
The short answer is interest rates: a hot CPI raises expectations of Fed tightening, and higher rates make assets that pay no yield relatively less attractive. It is an indirect chain, and any single day's move usually has several causes at once. The full explanation is in What Is CPI? How October's Hotter-Than-Expected Print Reaches Your Stocks and Crypto.
Track these readings yourself
Funding rates, open interest, volume and crowding all move continuously. You can read them directly on the crypto tab in the Nina app and sort by any column, or set a Sentinel — an alert that notifies you when one of them crosses a threshold you choose.
→ Download Nina, one tap for iOS and Android
Further reading
- What Is CPI? How October's Hotter-Than-Expected Print Reaches Your Stocks and Crypto: the macro backdrop behind this flush, and the full transmission chain.
- Bitcoin outlook: 4 conditions that show where BTC is stuck: how to read the crypto market's own flow conditions.
Sources: Hyperliquid prices, funding rates, long/short account ratios and stop-loss distribution are from Nina's crypto pages; named-wallet positions are from Nina's hourly snapshots; market-wide liquidation data is from CoinGlass; CPI figures were released by the US Bureau of Labor Statistics on 2026/11/10. The data window is 24 hours, to 2026/11/11.
Nina is an information and analysis tool, not a licensed investment adviser. Nothing above constitutes a recommendation to buy or sell. Derivatives and leveraged trading carry a high degree of risk and losses can exceed your initial capital. Prices, funding rates and positions change continuously; refer to the latest readings in Nina.
Nina is the Web3-native AI agent from Antalpha (NASDAQ: ANTA), covering crypto, prediction markets and US stocks: conclusion-first analysis with named sources and freshness badges, and Sentinel mode for round-the-clock monitoring. Vibe Trading, Nina's AI trading bot, turns a one-sentence trading idea into a rule-based bot that you backtest on historical data and then run in paper trading; live trading for Vibe Trading is not yet available. Backtest results are simulated on historical data and do not indicate future returns. Trades in the Nina app are signed by you in your own wallet by default (Verification-free ordering for Polymarket and perpetuals, which you turn on yourself, are signed by a key you authorized); Nina never holds your funds and takes no cut of principal or profits; a transparent routing fee applies on the execution path. Nothing here is investment advice or a price prediction. Official channels: antalpha.com, the Nina app on the App Store and Google Play, x.com/antalpha_ai.